
For the first few days we are providing the service for two areas, the first includes the UK, northern France, Holland, eastern Germany up to southern Norway; a separate area coveering the bay area around San Francisco is also included. We will roll out the service to more areas over the coming days with the intention of going global within a few weeks. All overlays have keys available at the bottom left and in addition these keys link to the wiki page for further details when clicked (or 'right clicked').
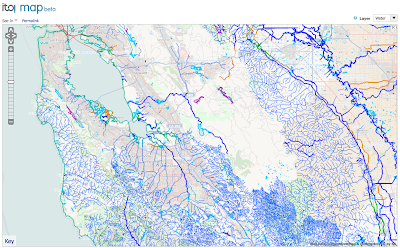
Here are examples from some of the 22 map views that are currently available. This first one shows water features around Bay Area in California. The colours are chosen to make a clear distinction between different feature types (rivers and streams are blue, canals are tan, lakes turquoise, reservoirs purple and the coast in green).
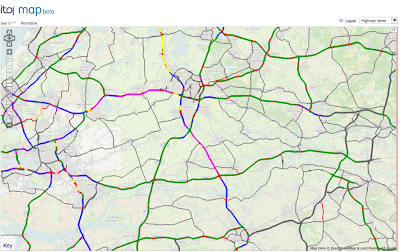
And this one shows the number of lanes for highways around Utrecht in Holland (dual 2 lane carriageways are shown in green, 3 lanes in blue, four lanes in purple and 6 lanes in yellow).
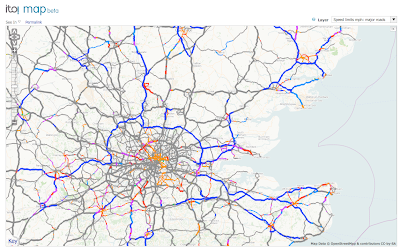
And road speed limits for major roads in the United Kingdom (70mph in dark blue, 60mph in light blue, 50mph in violet, 40mph in red and 30mph in orange).
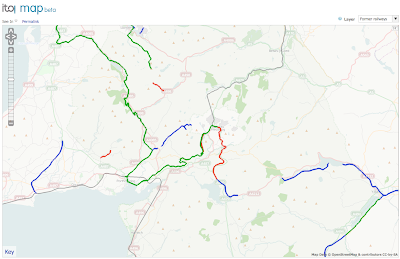
Former railways in north Wales (green for heritage lines, red for disused lines where the tracks still in place, blue for dismantled where the alignment is still in tact but the tracks have been lifted and violet for where there is no remaining evidence of the route).
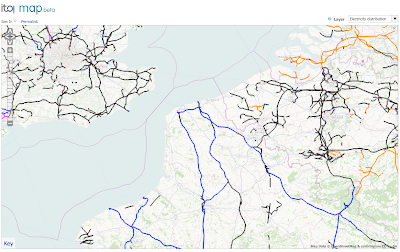
Electricity distribution in northern France and surrounding countries (dark blue for 400KV, purple for 320KV, orange for other high tension voltage and thin green lines for low voltage minor lines). Power generation plant and substations/transformers are also shown.
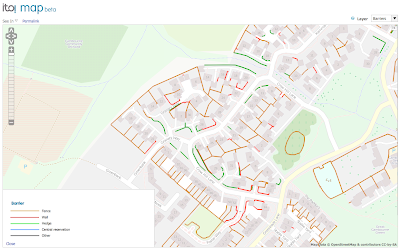
And finally some amazing 'micro-mapping' for Cambourne, Cambridgeshire detailing all the fences, hedges and walls in town (green for hedges, brown for fences and red for walls). I think this is a great example of how OpenStreetMap is going way beyond the place where commercial mapping stops.
The tiles will initially be based on daily diff planet data (which will normally be updated daily with a 24 hour processing lag). The service is likely to be slower after about 04:00 hours UTC when the new data is loaded. We are in the process of adding server capacity to improve performance further and allow a global release but wanted to get the service available for at least part of the world immediately. In the short term if the service is too slow then please give it a break for a hour or so and before trying again. The overlays can only display linear and area features at this stage, we will add the ability to handle nodes in due course. In time we will include overlays from other data sources as well as OpenStreetMap, hence the name 'ITO Map' rather than somthing which included OpenStreetMp or OSM in the title.
Do add comments and suggestions to the wiki page. We will gather feedback over the next week and iron out any wrinkles.


No comments:
Post a Comment